AI Amazon Repricer
Boost your Amazon profits and avoid price wars with AI repricing
 Skip to content



Share this post


Only about one in five products actually got a price cut during Prime Day 2026, and those products captured almost all of the growth in sales. A closer look at the pricing data behind the winners and losers.
When I first broke Prime Day 2026 down by category, the story looked like consumer psychology – shoppers were buying the exciting big ticket items instead of the routine, everyday items. Prime Day is one of the biggest Amazon shopping events of the year, and consumers are driven to the site with high intent, not to buy what they usually buy, but to buy that item they’ve been thinking about. However, what I had not yet measured was what happened to the price of each product on the shelf, and how did price itself impact consumer demand.
So I ran the comparison the slow way. I pulled a random set of 100,000 products from the USA that sold both in early June and during Prime Day, then looked at what shoppers actually paid for each product before the event and during it. The same products measured at two points in time.
A simpler explanation sat underneath the psychology. Prime Day demand did not follow categories: it followed price cuts.
Most Prime Day coverage rests on an assumption that rarely gets checked, which is that everything goes on sale. It does not.
Only 18% of products had a real price cut, meaning 5% or deeper, during Prime Day 2026. The large majority, 69%, barely moved at all. Another 12.5% were actually more expensive during the event than they had been in early June.
Share of Amazon products by real price change during Prime Day 2026, only 18% saw a cut of 5% or more
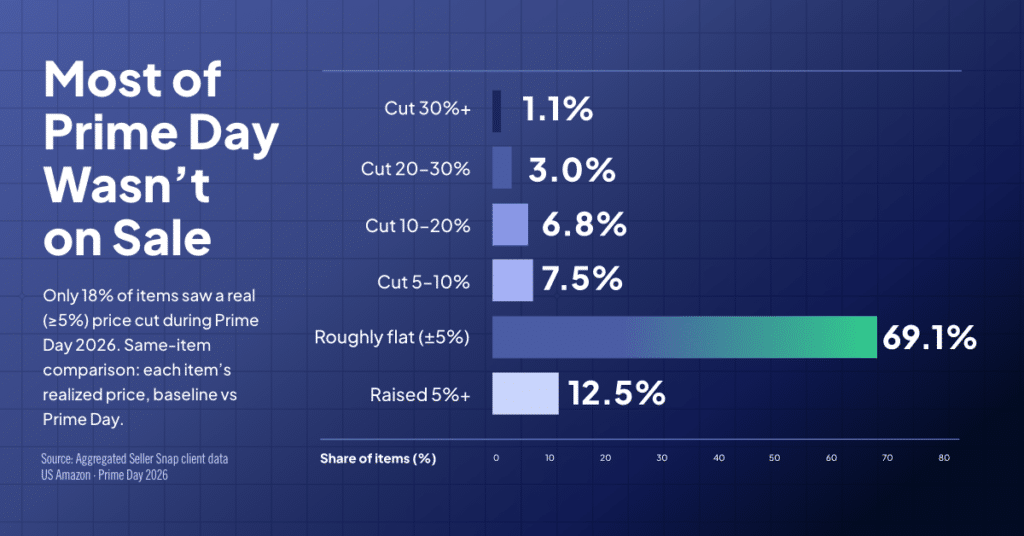
Prime Day is a thin layer of deals sitting on top of a mostly full-price catalog.
That changes the question worth asking. If discounts are the exception rather than the rule, the thing to analyze is not what shoppers wanted, but where the discounts actually were.
I sorted all 100k products by how deep their price cut was and measured how many more units each group sold.
Products discounted 30% or more sold 771% more units than they had in early June. Cuts of 20% to 30% brought a 226% lift. Cuts of 10% to 20% brought 103%, and cuts of 5% to 10% brought 40%. Each deeper tier of discount produced a bigger jump in sales, with no exceptions.
Prime Day 2026 unit lift by depth of real price cut, from 771% for the deepest cuts down to a 13% decline for price increases
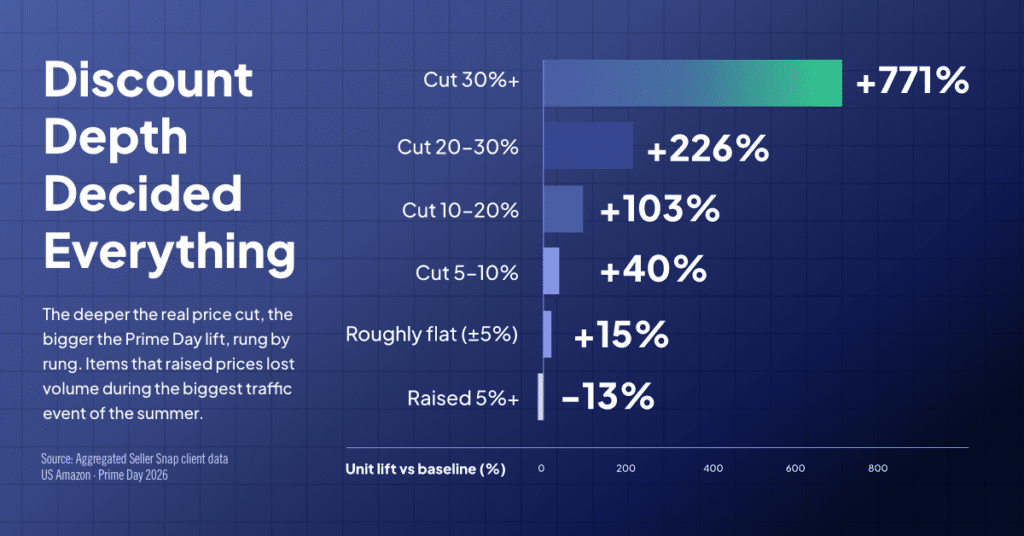
Sales tracked the size of the discount, step by step.
Two groups are worth pausing on.
Products that held their price flat grew only 15%. That is roughly what the extra Prime Day traffic delivers on its own, with no discount attached. Products that raised their price lost 13% of their volume, and they did so during the busiest shopping event of the summer.
Taken together, the 18% of products with a genuine discount accounted for 70% of all the unit growth Prime Day produced.
One objection is that discounted products might simply be different in kind, flashier or more giftable, the sort of thing people reach for on Prime Day anyway. There is a clean way to test that. Within each category, I split the products into two groups, the ones with a deal and the ones without, and compared them. Same aisle, same shoppers, same week. The main thing separating the two groups was the price tag.
Across 215 categories with enough products and sales both before and during Prime Day, the discounted group rose 89% on average. The full-price products sitting right beside them rose 13%. The discounted group came out ahead in 91% of categories.
Within the same category, products with a Prime Day deal out-lifted products without one in 91% of categories
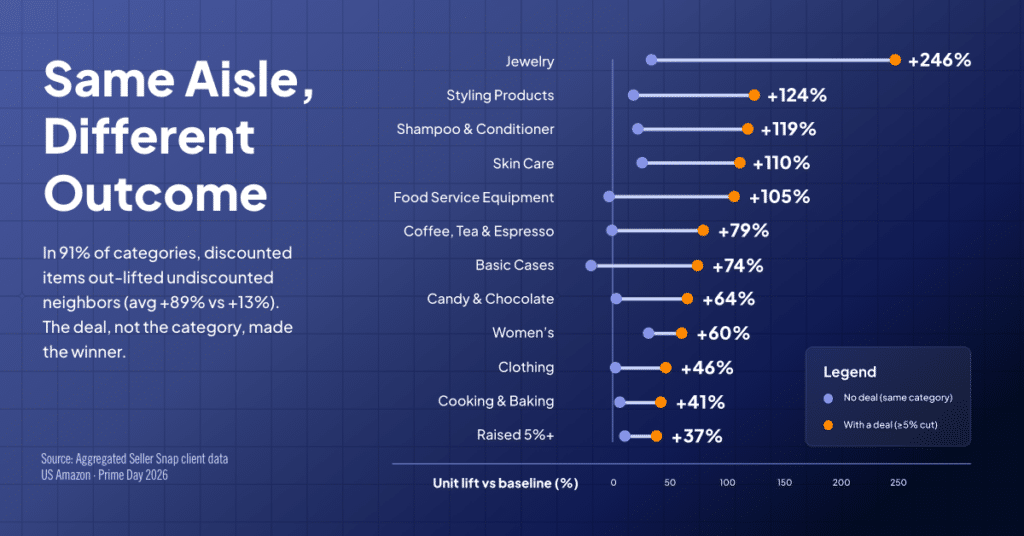
Within a single category, discounted products pulled well ahead of their full-price shelfmates.
This is where the exciting-versus-boring explanation breaks down. Discounted household cleaning supplies outsold full-price household cleaning supplies. Discounted shampoo outsold full-price shampoo. Nobody buys a mop to feel aspirational. What moved these products was the discount, not the category they happened to sit in.
Seen this way, I can only display category performance by controlling for the discounts presented. For each headline category, it helps to put the share of its products that were actually discounted next to how the category performed.
Start with skin care tools, up 551% in same-item units. The category also had one of the highest discount coverage of any headline group, with 43% of its products marked down. The runaway winner of Prime Day was not a mood or a trend. It was the most heavily discounted corner of the store.
The much-discussed analog revival looks similar. Digital cameras had discounts on 31% of their products and orders rose 115%. Film photography had discounts on just 12% and fell 22%. The gap in nostalgia is really a gap in discounting. Film did not fall because the trend cooled. It simply never went on sale.
An interesting case is swimming pools, where not a single product was discounted. The category fell 33%. That happened in late June, at the height of pool season, with record traffic on the site. There were no discounts, and the category sank anyway.
311 Amazon categories: the share of products on deal strongly predicts the category’s Prime Day lift
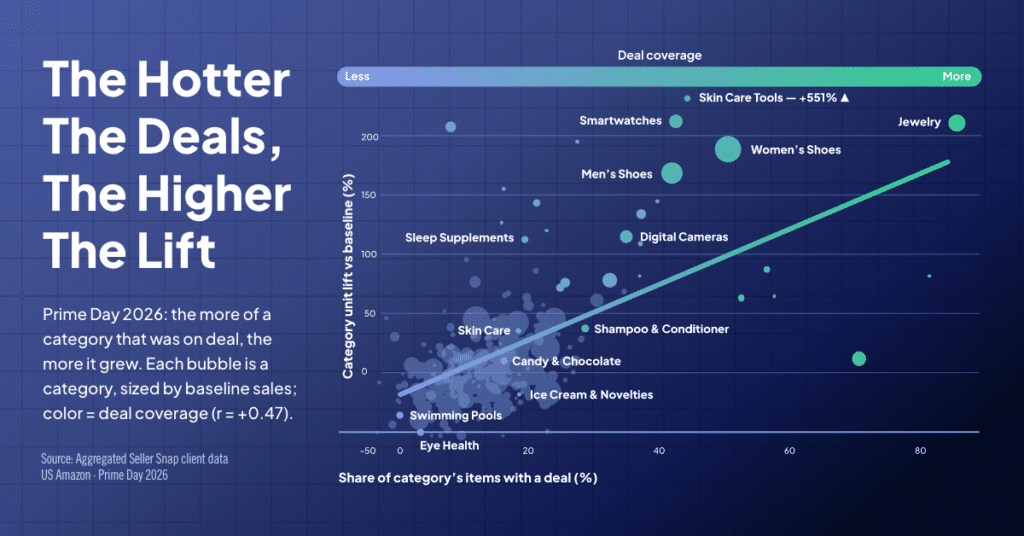
Across 311 categories, the more of a category that went on sale, the more it grew.
One piece of the psychology story does hold up, and it is worth being straight about. Fresh food, and every day purchases for that matter, behaves differently. Ice cream fell 26% even though 17% of its products were discounted. An explanation is that the routine grocery run tends to slide to the following week while people chase the bigger discounts, and the more eye catching products.
Looking at Prime Day through discounts leads to one more prediction. If the spike is driven by price cuts, it is not really new demand. It is demand borrowed from July and pulled forward by a discount. If that holds, the categories that cut prices hardest should fall the furthest below normal once the event ends.
That is what happened. Clothing, the deepest discounter of the event, jumped 88% during Prime Day, then ran 13% below normal the following week and 22% below the week after that. Electronics followed the same path, up 28% during the event and down 17% afterward. Grocery, which barely discounted, barely dipped.
Prime Day 2026 spike and post-event trough by category, deep-discount categories fell furthest below baseline afterward
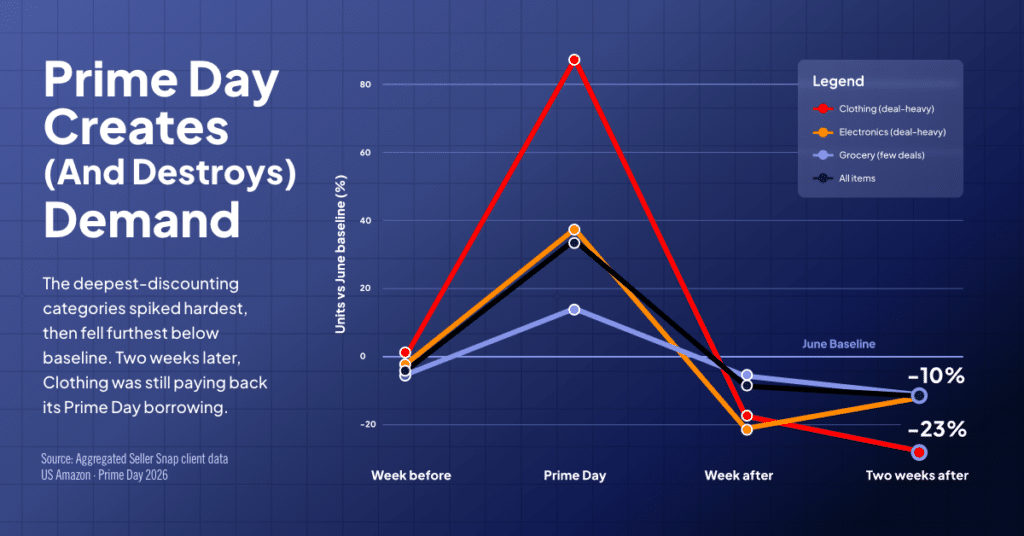
The categories that discounted hardest fell the furthest once the event ended.
Prime Day, although it did create demand, also moved demand, concentrating it into four days and steering it toward whatever was cheapest.
Your price is your Prime Day result. A 30% cut brought a 771% lift, a flat price brought 15%, and letting the price drift up 5% cost 13% of volume even with record traffic on the site. Heavy traffic does not rescue an noncompetitive price: it exposes it.
You are not really competing with your category. You are competing with the discounted product next to yours. In nine of ten categories, the discounted group took the growth and left little for everyone else, and that held even in the dullest aisles in the store.
Plan for the drop that follows. Part of the lift you buy during the event is borrowed from the weeks right after it. Inventory, advertising and pricing plans should account for that payback, not just the spike.
Prime Day is often called the biggest test of consumer demand on the calendar. Demand does skyrocket, but the buyers themselves are discount driven.
The demand was there and the discount decided who got it.
Methodology: aggregated, anonymized Seller Snap client order data, Amazon US. The analysis uses a same-item group of more than 100,000 products that sold in both the baseline window (June 2–15) and during Prime Day (June 23–26). Realized price is revenue divided by units for each product in each window, so every product is compared against itself and differences in product mix are controlled for. A product counts as on deal when its realized price is at least 5% below its baseline price. The post-event windows are June 27 to July 3 and July 4 to 10. All figures are percentage changes.

 4.9 on the Amazon App Store
x


